

A Step by Step Guide to Code Profiling in Python
Code Optimization. How it works and Is it worth the Hassle?


As programmers and software developers writing code is not enough, just because the code works doesn’t mean it is effective. Optimizing our code for improved performance should be one of the tenets of software development. Code profiling helps us to achieve this by helping developers to find bottlenecks and redundancies in their software and fix them.
Prerequisites: Knowledge of the Python programming language is crucial
Definition of Code Profiling
What is Code Profiling:
In software engineering, profiling ("program profiling", "software profiling") is a form of dynamic program analysis that measures, for example, the space (memory) or time complexity of a program, the usage of particular instructions, or the frequency and duration of function calls. Most commonly, profiling information serves to aid program optimization, and more specifically, performance engineering. - Wikipedia
Code profiling refers to the proper appraisal and examination of a software's source code to find the slowest parts of the code as well as parts that are consuming a lot of resources and optimize these parts of the code to improve the performance of the software.
The Purpose of Code Profiling
Why is Code Profiling Necessary
Code profiling is necessary to help software developers and engineers find bottlenecks in the source code of their software. These bottlenecks could result in performance issues such as poor user experience and overconsumption of resources. Code Profiling helps developers find parts of their code containing such bottlenecks and fix them.
What is Code Optimization
Code optimization is a set of procedures taken to improve code by making it consume lesser resources while also providing high performance.
Code profiling can be said to be a form of code optimization as it aids software developers reach their software performance goals by providing an interface to help them find bottlenecks preventing them from achieving these goals in their code.
Profiling Tools
These are software or libraries that aid software developers in the code profiling process. For this article, we'll be looking at a few code profiling libraries from the Python programming language.
timeit
This Python module allows developers to be able to time small bits of their Python code. timeit docs.
Let's try to time a simple Python code with timeit
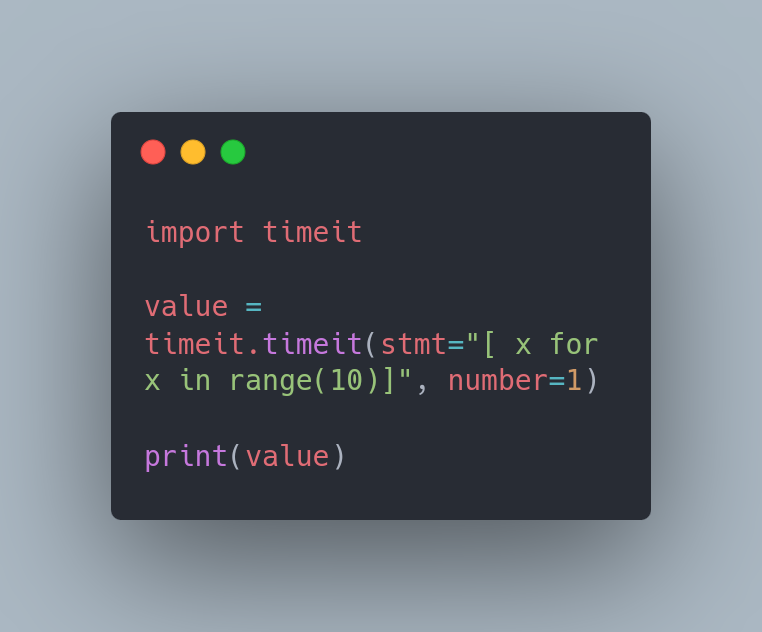
In the code above we first import the timeit module.
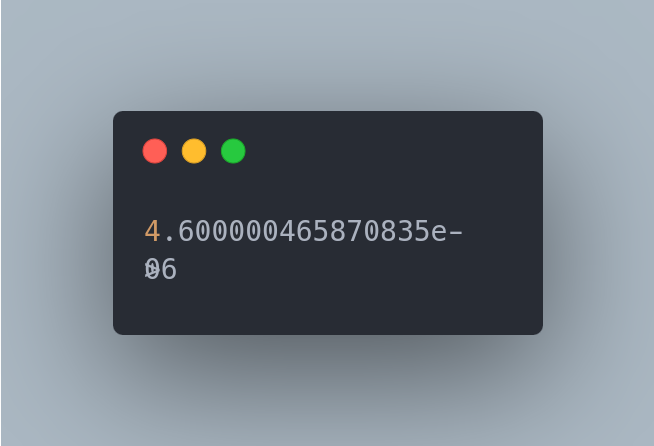
We then use the timeit.timeit() method to time a piece of code which is declared as a statement in the method's "stmt" keyword argument. The "number" keyword argument refers to the number of times the statement provided is going to be executed by the method. In the end, this method returns a floating point number of the time it took for the statement provided to be executed in seconds which we stored in the variable, "value" and printed out as shown below:
cProfile
This Python module is used to measure the time it takes for a function to be executed as well as the number of times a function is executed. cProfile docs.
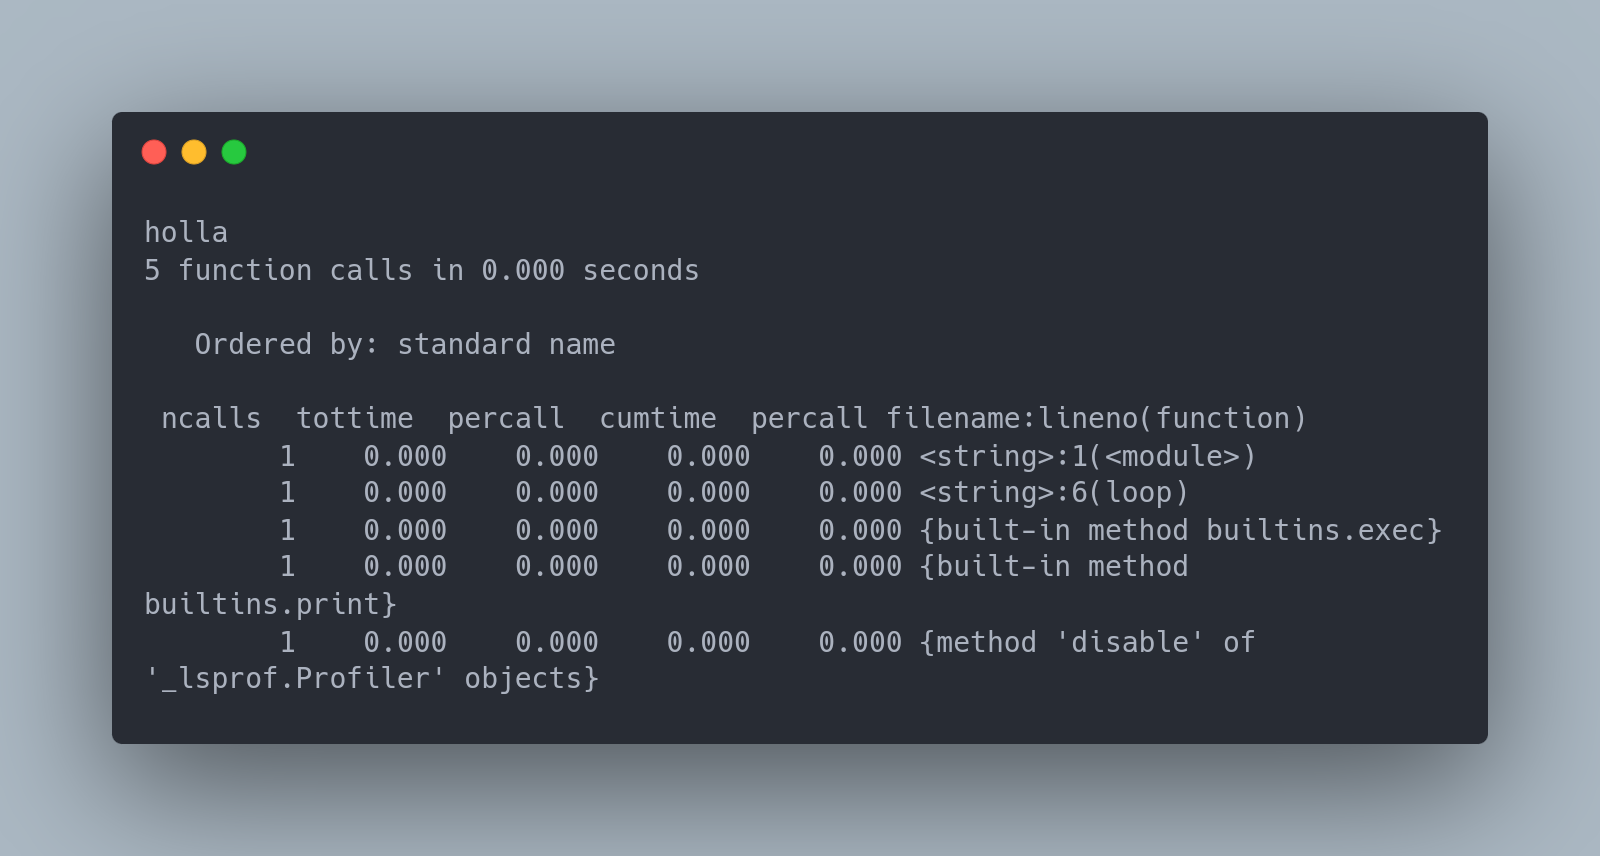
Now let's try using cProfile to time a simple function

In the code above, we first import cProfile as profile. We then create a function named loop which takes an argument "text" and prints it out when being called. Lastly, we called the run() method of the cProfile module and provided the function call as an argument. After the code ran, it provided the statistics shown below
Interpreting Profiling Results
Profiling code is just one piece of the puzzle, understanding the output or metrics used by profilers to profile the code is another part of the puzzle.
Understanding the Metrics
When using the timeit module to time a piece of code the output was relatively easy to comprehend but for more complex outputs such as the one given by cProfile, understanding the multiple metrics used to profile the code becomes essential.
For this example, we'll be interpreting the results of the cProfile profiler we saw above.

The cProfile output is divided into five distinct parts:
ncalls: This is the number of times the function is called.
tottime: This refers to the total time spent in the function without taking into consideration other function calls.
percall: This refers to the time spent for a single call of the function.
cumtime: This refers to the time spent in the function including other function calls.
filename:lineno: This refers to the filename and its corresponding line numbers.
Profiling Best Practices
These are a few procedures to take to make the code profiling process smoother
Write Concise Code: it is important to make sure your code is clear and concise. Chunk your code into smaller pieces. Also, make sure that each function handles only one operation.
Be Patient: profiling code can be a long and tedious process as some of the bottlenecks don't come off easily. Equally, profiling a long codebase will also require patience.
Profiling Case Study
This will show a simple practical use case of code profiling.
Case Study

In the code above, we created two functions, one of the functions has a little time delay of three seconds while the other has no time delay.
Assuming this time delay is a bottleneck, let's see if the cProfile profiler will detect this slight delay once we run the code
Output
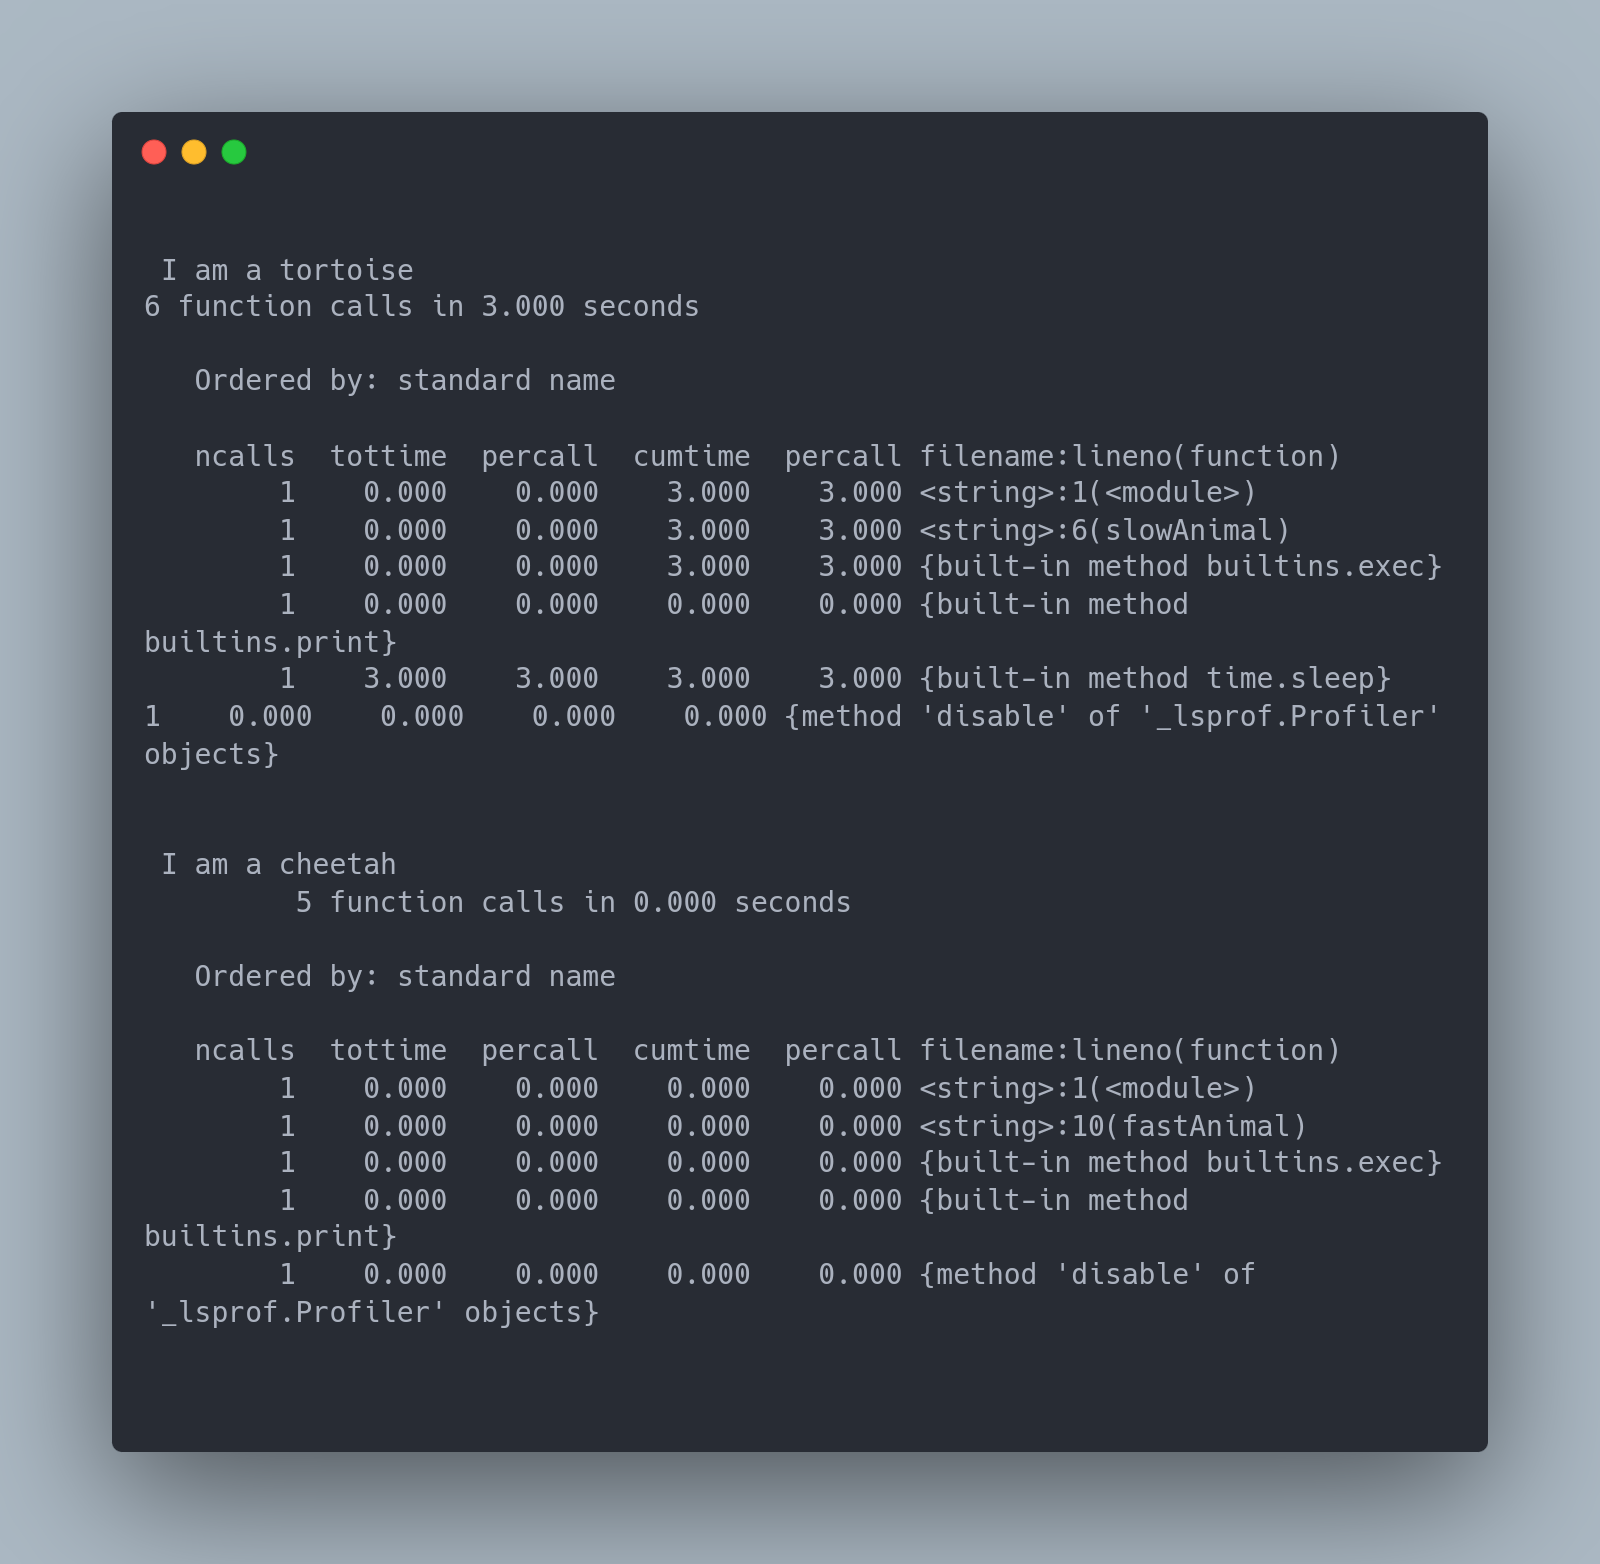
From the output above, we can say that cProfile successfully detected the delay in the first function as seen in the time it took to execute the function.
In conclusion, code profiling is a great way of optimizing our code for improved performance by finding the bottlenecks preventing it from running at its peak performance.